Week 8 play of the week
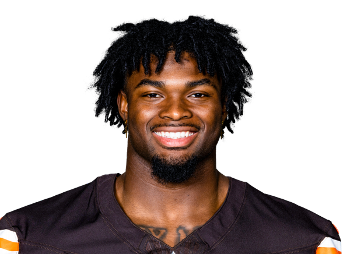

32.6UPS points · Josh Martel
At the desk: Stuart, Rich & Boomer · Kenny Mayne in the Coffee Shop
Bear Dunn led Week 8 with 307.6. Automated draft from the league’s own data, awaiting the editor.
Week 8 at the desk, Rich. Bear Dunn put up 307.6, the best score of the week, and beat all eleven teams in all-play. The closest game was Josh Martel over Ryan Bousquet, by 3.7.
Bear Dunn, Eric Martel, Josh Martel and Shawn Blake won every game. Eric Mannila, Keith Creelman, Brian Cross and Derrick Whitman did not win one.
The biggest margin of the week was Bear Dunn over Eric Mannila, by 89.5. Boomer, take it away.
Thanks, Stu! Joe Burrow, QB for Bear Dunn: 54.4 UPS points. 38-of-48 for 462, 5 TD, 3 INT; 3 carries for 10 and 1 TD. Bear Dunn went 2–0 this week.
Tee Higgins, WR for Bear Dunn: 42.3 UPS points. Bear Dunn went 2–0 this week.
Tyler Allgeier, RB for Eric Mannila: 38.5 UPS points. Eric Mannila went 0–2 this week.
Kirk Cousins, QB for Eric Mannila: 36.3 UPS points. Eric Mannila went 0–2 this week.
Ja'Marr Chase, WR for Eric Martel: 35.5 UPS points. 11 catches on 16 targets for 141 and 1 TD; 1 tackles. Eric Martel went 2–0 this week.
Stu, Rich, that is your division desk. I am out.


Bear Dunn scored 307.6 and went 2–0: beat Eric Mannila by 89.5, Chris Klingenberg by 78.4.
Chris Klingenberg scored 229.2 and went 1–1: beat Eric Mannila by 11.1; lost to Bear Dunn by 78.4.
Eric Mannila scored 218.1 and went 0–2: lost to Bear Dunn by 89.5, Chris Klingenberg by 11.1. His best available lineup, 244.5, would have won a game he lost.


Eric Martel scored 243.5 and went 2–0: beat Brian Cross by 61.7, Brian Cutting by 39.6.
Brian Cutting scored 203.9 and went 1–1: beat Brian Cross by 22.1; lost to Eric Martel by 39.6.
Brian Cross scored 181.8 and went 0–2: lost to Eric Martel by 61.7, Brian Cutting by 22.1. His best available lineup, 211.0, would have won a game he lost.


Shawn Blake scored 210.7 and went 2–0: beat Derrick Whitman by 44.5, Matt Gerardi by 24.1.
Matt Gerardi scored 186.6 and went 1–1: beat Derrick Whitman by 20.4; lost to Shawn Blake by 24.1. His best available lineup, 215.7, would have won a game he lost.
Derrick Whitman scored 166.2 and went 0–2: lost to Shawn Blake by 44.5, Matt Gerardi by 20.4. His best available lineup, 188.5, would have won a game he lost.

Josh Martel scored 218.0 and went 2–0: beat Keith Creelman by 34.0, Ryan Bousquet by 3.7.
Ryan Bousquet scored 214.3 and went 1–1: beat Keith Creelman by 30.3; lost to Josh Martel by 3.7. His best available lineup, 235.2, would have won a game he lost.
Keith Creelman scored 184.0 and went 0–2: lost to Josh Martel by 34.0, Ryan Bousquet by 30.3. His best available lineup, 221.2, would have won a game he lost.
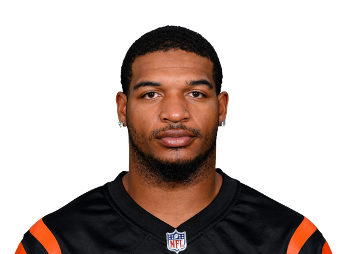

11 catches on 16 targets for 141 and 1 TD; 1 tackles
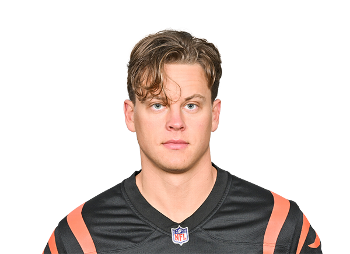

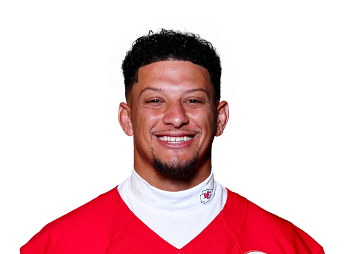
30-of-41 for 321, 3 TD; 2 carries for 6
The biggest bargain: Joe Burrow for Bear Dunn, projected 15.6, scored 54.4.
The biggest bust: Lamar Jackson for Brian Cutting, projected 16.4, scored 0.0.
Lamar Jackson (QB, Brian Cutting)1 passes, 15 air yards · MFL proj. Sun 12:03 PM ET · kickoff Sun 1:00 PM ET16.4 → 0.0-16.4Zay Flowers (WR, Brian Cutting)5 targets, 43 air yards · MFL proj. Sun 12:03 PM ET · kickoff Sun 1:00 PM ET16.1 → 0.0-16.1Michael Penix Jr. (QB, Eric Martel)24 passes, 209 air yards, 5 carries · MFL proj. Sun 12:03 PM ET · kickoff Sun 1:00 PM ET14.6 → -0.9-15.5 Jacoby Brissett (QB, Keith Creelman)23 passes, 266 air yards, 3 carries · MFL proj. Sun 12:03 PM ET · kickoff Sun 1:00 PM ET15.5 → 1.1-14.4Parker Washington (WR, Keith Creelman)2 targets, 19 air yards, 1 carry · MFL proj. Sun 12:03 PM ET · kickoff Sun 1:00 PM ET18.4 → 4.0-14.4Joe Burrow (QB, Bear Dunn)48 passes, 453 air yards, 3 carries · MFL proj. Sun 12:03 PM ET · kickoff Sun 1:00 PM ET15.6 → 54.4+38.8Tyler Allgeier (RB, Eric Mannila)11 carries, 5 targets · MFL proj. Sun 12:03 PM ET · kickoff Sun 1:00 PM ET4.7 → 38.5+33.8Harold Fannin (TE, Josh Martel)12 targets, 84 air yards · MFL proj. Sun 12:03 PM ET · kickoff Sun 1:00 PM ET9.3 → 32.6+23.3Tee Higgins (WR, Bear Dunn)11 targets, 121 air yards · MFL proj. Sun 12:03 PM ET · kickoff Sun 1:00 PM ET19.3 → 42.3+23.0
 Bhayshul Tuten (RB, Shawn Blake)16 carries, 2 targets · MFL proj. Sun 12:03 PM ET · kickoff Sun 1:00 PM ET9.4 → 31.5+22.1Tykee Smith (DB, Derrick Whitman)MFL proj. Sun 12:03 PM ET · kickoff Sun 1:00 PM ET8.3 → 2.1-6.2Keisean Nixon (DB, Brian Cutting)MFL proj. Thu 7:47 PM ET · kickoff Thu 8:15 PM ET8.7 → 2.6-6.1Jack Campbell (LB, Eric Martel)MFL proj. Sun 12:03 PM ET · kickoff Sun 1:00 PM ET7.4 → 1.5-5.9Josiah Trotter (LB, Brian Cutting)MFL proj. Sun 12:03 PM ET · kickoff Sun 1:00 PM ET9.0 → 4.0-5.0Nik Bonitto (DL, Brian Cutting)MFL proj. Sun 2:20 PM ET · kickoff Sun 4:25 PM ET6.4 → 2.0-4.4Quinnen Williams (DL, Shawn Blake)MFL proj. Sun 12:03 PM ET · kickoff Sun 1:00 PM ET4.3 → 17.5+13.2Alex Anzalone (LB, Chris Klingenberg)MFL proj. Sun 12:03 PM ET · kickoff Sun 1:00 PM ET5.6 → 16.5+10.9CJ Allen (LB, Chris Klingenberg)MFL proj. Sun 12:03 PM ET · kickoff Sun 1:00 PM ET1.4 → 11.5+10.1Jordan Battle (DB, Brian Cross)MFL proj. Sun 12:03 PM ET · kickoff Sun 1:00 PM ET7.6 → 17.1+9.5George Karlaftis (DL, Chris Klingenberg)MFL proj. Sun 2:20 PM ET · kickoff Sun 4:25 PM ET5.1 → 14.5+9.4
Started players only. Projection source: each player’s last MFL projection saved before his own kickoff, captured Thu Oct 29, 7:47 PM ET, Sun Nov 1, 12:03 PM ET, Sun Nov 1, 2:20 PM ET; every row shows its capture time and the player’s own kickoff, and every capture came first. 192 offensive and defensive starters graded; 0 not graded for want of a pregame capture. Largest gaps among graded starters, not every starter.
Bear Dunn leads the field at 78–10 against everyone, 19–2 overall.
| Franchise | Division | Record | Week 8 all-play | All-play | Points for |
|---|---|---|---|---|---|
| Bear Dunn | leader | 19–2 | 11–0 | 78–10 | 2,149.2 |
| Eric Martel | leader | 16–5 | 10–1 | 66–22 | 1,926.1 |
| Shawn Blake | leader | 11–10 | 5–6 | 53–35 | 1,824.3 |
| Brian Cutting | 12–9 | 4–7 | 52–36 | 1,803.8 | |
| Chris Klingenberg | 13–8 | 9–2 | 51–37 | 1,674.4 | |
| Keith Creelman | leader | 10–11 | 2–9 | 41–47 | 1,695.4 |
| Derrick Whitman | 11–10 | 0–11 | 49–39 | 1,729.7 | |
| Eric Mannila | 11–10 | 8–3 | 42–46 | 1,658.6 | |
| Ryan Bousquet | 8–13 | 6–5 | 30–58 | 1,545.6 | |
| Matt Gerardi | 4–17 | 3–8 | 23–65 | 1,484.2 | |
| Brian Cross | 5–16 | 1–10 | 22–66 | 1,519.2 | |
| Josh Martel | 6–15 | 7–4 | 21–67 | 1,472.3 |
In the same order as the league standings page: the current playoff field first (division leaders take the top two places), then everyone else; every place goes by all-play percentage, then overall record, then points for, then head-to-head.
| Week 8 matchup | Our favorite | Final | Called it? |
|---|---|---|---|
| Brian Cutting vs Brian Cross | Brian Cutting (83%) | 203.9–181.8 | yes |
| Eric Martel vs Brian Cross | Eric Martel (82%) | 243.5–181.8 | yes |
| Bear Dunn vs Chris Klingenberg | Bear Dunn (78%) | 307.6–229.2 | yes |
| Keith Creelman vs Josh Martel | Keith Creelman (78%) | 184.0–218.0 | no |
| Bear Dunn vs Eric Mannila | Bear Dunn (77%) | 307.6–218.1 | yes |
| Keith Creelman vs Ryan Bousquet | Keith Creelman (66%) | 184.0–214.3 | no |
| Ryan Bousquet vs Josh Martel | Ryan Bousquet (64%) | 214.3–218.0 | no |
| Derrick Whitman vs Matt Gerardi | Derrick Whitman (52%) | 166.2–186.6 | no |
| Shawn Blake vs Matt Gerardi | Shawn Blake (52%) | 210.7–186.6 | yes |
| Brian Cutting vs Eric Martel | Brian Cutting (51%) | 203.9–243.5 | no |
| Shawn Blake vs Derrick Whitman | Shawn Blake (50%) | 210.7–166.2 | yes |
| Eric Mannila vs Chris Klingenberg | Eric Mannila (50%) | 218.1–229.2 | no |
Last week’s published preview, graded against the final scores: favorites won 6 of 12.
Bear Dunn leads the forecast at 100.0% to make the playoffs.
| Franchise | Playoffs | First-round bye | Wins division | Title |
|---|---|---|---|---|
| Bear Dunn | 100.0% | 99.9% | 99.9% | 39.2% |
| Eric Martel | 99.6% | 78.1% | 85.0% | 18.9% |
| Brian Cutting | 95.7% | 13.2% | 15.0% | 23.5% |
| Shawn Blake | 89.5% | 8.2% | 80.8% | 9.1% |
| Keith Creelman | 77.4% | 0.1% | 76.8% | 3.4% |
| Chris Klingenberg | 68.5% | 0.1% | 0.1% | 3.5% |
| Derrick Whitman | 34.5% | 0.3% | 19.1% | 1.3% |
| Ryan Bousquet | 21.4% | 0.0% | 21.2% | 0.4% |
| Eric Mannila | 11.5% | 0.0% | 0.0% | 0.7% |
| Josh Martel | 1.9% | 0.0% | 2.0% | 0.0% |
| Matt Gerardi | 0.1% | 0.0% | 0.1% | 0.0% |
| Brian Cross | 0.0% | 0.0% | 0.0% | 0.0% |
Probabilities updated after Week 8 (Wed Nov 4, 10:02 AM ET), 10,000 simulated seasons. One team wins each division in every simulated season; division odds and the league’s title odds are rounded so each group still adds up to the whole.
| Team Reading | All-Play Wks 6–8 (season) | Scoring rank Wks 1–5 → Wks 6–8 |
|---|---|---|
| Bear Dunn Dominant | 33–0 (78–10) | 1st → 1st |
| Eric Martel Dominant | 29–4 (66–22) | 3rd → 2nd |
| Chris Klingenberg Rising | 22–11 (51–37) | 8th → 4th |
| Brian Cutting Holding | 21–12 (52–36) | 4th → 3rd |
| Eric Mannila Holding | 19–14 (42–46) | 7th → 6th |
| Derrick Whitman Holding | 17–16 (49–39) | 6th → 5th |
| Shawn Blake Cooling | 13–20 (53–35) | 2nd → 7th |
| Ryan Bousquet Holding | 10–23 (30–58) | 10th → 9th |
| Josh Martel Holding | 10–23 (21–67) | 12th → 10th |
| Keith Creelman Holding | 9–24 (41–47) | 5th → 8th |
| Brian Cross Holding | 8–25 (22–66) | 9th → 12th |
| Matt Gerardi Holding | 7–26 (23–65) | 11th → 11th |
Sorted by All-Play over Weeks 6–8; the full-season All-Play record is in parentheses. Reading, applied in order: Dominant = at least 28 of every 33 all-play games in that stretch; Sinking = 5 of every 33 or fewer; Rising / Cooling = scoring rank moved four or more places; otherwise Holding.
| Team | Left on bench / wk | Losses the best lineup would have won | Wins vs expected |
|---|---|---|---|
| Brian Cutting | 42.0 | 5 of 9 | −0.5 |
| Eric Martel | 34.3 | 3 of 5 | +0.6 |
| Chris Klingenberg | 31.9 | 2 of 8 | +0.5 |
| Derrick Whitman | 28.6 | 5 of 10 | −1.1 |
| Keith Creelman | 28.2 | 5 of 11 | −0.1 |
| Eric Mannila | 27.6 | 5 of 10 | +1.7 |
| Matt Gerardi | 26.0 | 6 of 17 | −1.1 |
| Josh Martel | 23.7 | 4 of 15 | +1.5 |
| Ryan Bousquet | 22.9 | 4 of 13 | +1.0 |
| Bear Dunn | 22.9 | 2 of 2 | −0.1 |
| Shawn Blake | 22.9 | 5 of 10 | −2.0 |
| Brian Cross | 19.6 | 4 of 16 | −0.5 |
Bench points = the best possible lineup from the same roster, known only after the games, minus the lineup started. Wins vs expected = head-to-head wins minus the wins each week’s all-play rate would give.
| Team | Category, playoffs | Made it from the same All-Play rank, 2017–2025 | Made it with the same win total, 2021–2025 |
|---|---|---|---|
| Bear Dunn | Contender 100.0% | 19/20 | 6/6 |
| Eric Martel | Contender 99.6% | 19/20 | 6/6 |
| Brian Cutting | Contender 95.7% | 15/16 | 8/12 |
| Shawn Blake | In the field 89.5% | 15/16 | 8/12 |
| Keith Creelman | In the field 77.4% | 7/19 | 8/12 |
| Chris Klingenberg | In the field 68.5% | 9/18 | 12/15 |
| Derrick Whitman | In the race 34.5% | 9/18 | 8/12 |
| Ryan Bousquet | Needs a run 21.4% | 1/17 | 4/20 |
| Eric Mannila | Needs a run 11.5% | 7/19 | 8/12 |
| Josh Martel | Life support 1.9% | 3/18 | 4/20 |
| Matt Gerardi | Life support 0.1% | 1/17 | 0/7 |
| Brian Cross | Life support 0.0% | 3/18 | 0/7 |
“Made it”: teams in the same position after Week 8 of a past season who went on to make the playoffs, out of all such teams. All-Play rank is grouped in pairs (tied teams share the higher rank); win totals are grouped in five bands, among seasons with the same number of games so far. Categories come from this week’s playoff odds: Contender 90% or better, In the field 60–90, In the race 25–60, Needs a run 8–25, Life support under 8.
Before we close, the chat. Owners posted 70 times between Thu Oct 29, 8:15 PM ET and Wed Nov 4, 10:00 AM ET. Kenny.
| Owner | Posts |
|---|---|
| Keith Creelman | 15 |
| Josh Martel | 13 |
| Brian Cutting | 10 |
| Shawn Blake | 10 |
| Ryan Bousquet | 9 |
| Eric Martel | 8 |
| Bear Dunn | 3 |
| Brian Cross | 2 |
| Chris Klingenberg | 0 |
| Derrick Whitman | 0 |
| Eric Mannila | 0 |
| Matt Gerardi | 0 |
Owner posts in the archived league Discord channels in that window; bot posts excluded.